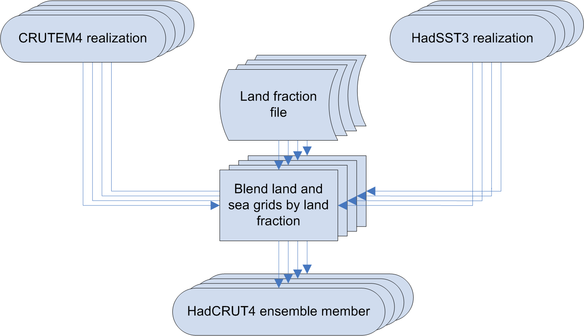
Figure 1 - The generation of the HadCRUT4 ensemble by land-fraction-weighted one-to-one blends of the 100 HadSST3 ensemble members with 100 realizations of the CRUTEM4 dataset.
| Met Office Hadley Centre observations datasets |
| > Home > HadCRUT4 > |
Figure 1 - The generation of the HadCRUT4 ensemble by land-fraction-weighted one-to-one blends of the 100 HadSST3 ensemble members with 100 realizations of the CRUTEM4 dataset.
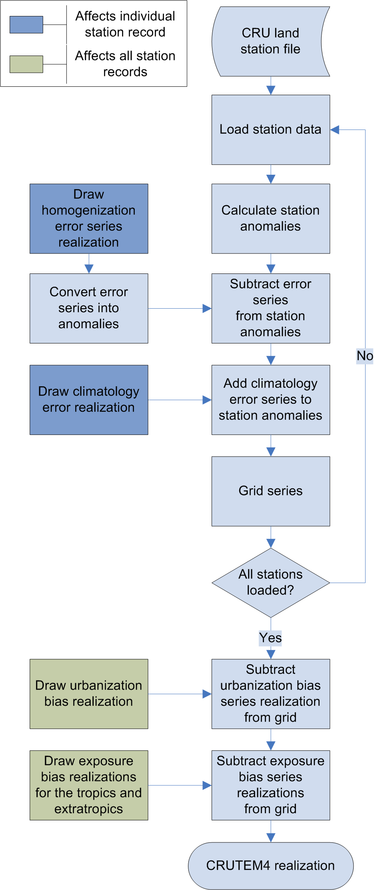
Figure 2 - Flow chart of the ensemble CRUTEM4 dataset generation process, with processes that are allowed to vary in each ensemble member indicated.
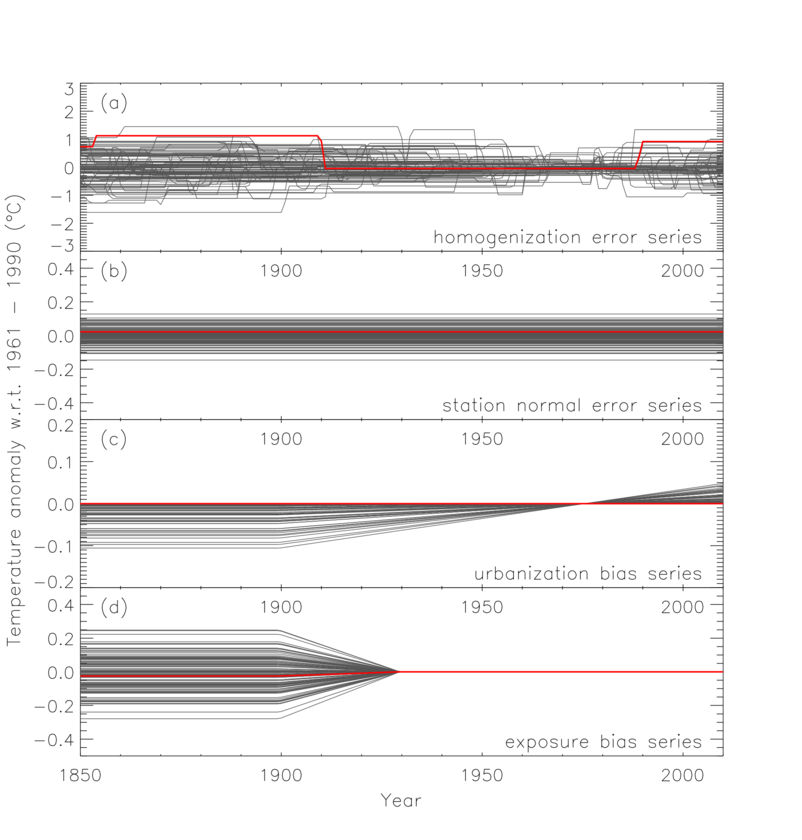
Figure 3 - 100 realizations of each uncertainty component contributing to the CRUTEM4 ensemble realizations, with an example realization of each component highlighted in red. Homogenization and station normal error realizations are drawn for each individual station record. Urbanization bias instances apply globally. Different values of exposure bias are applied uniformly across the extratropics (shown) and the tropics.
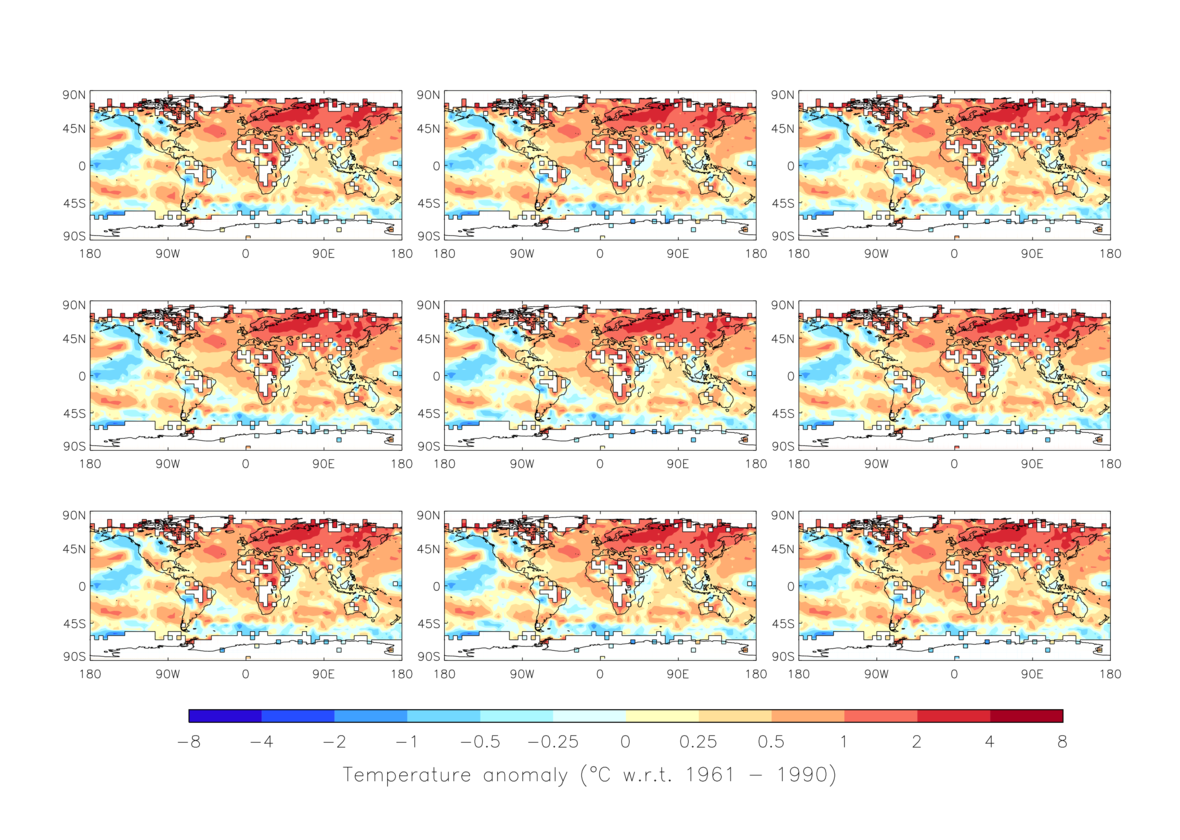
Figure 4 - Annual average surface temperature anomalies for 2008 (deg C with respect to 1961-1990) for 9 ensemble members of HadCRUT4. Anomalies are shown only for grid-boxes in which at least 6 months of data are available.
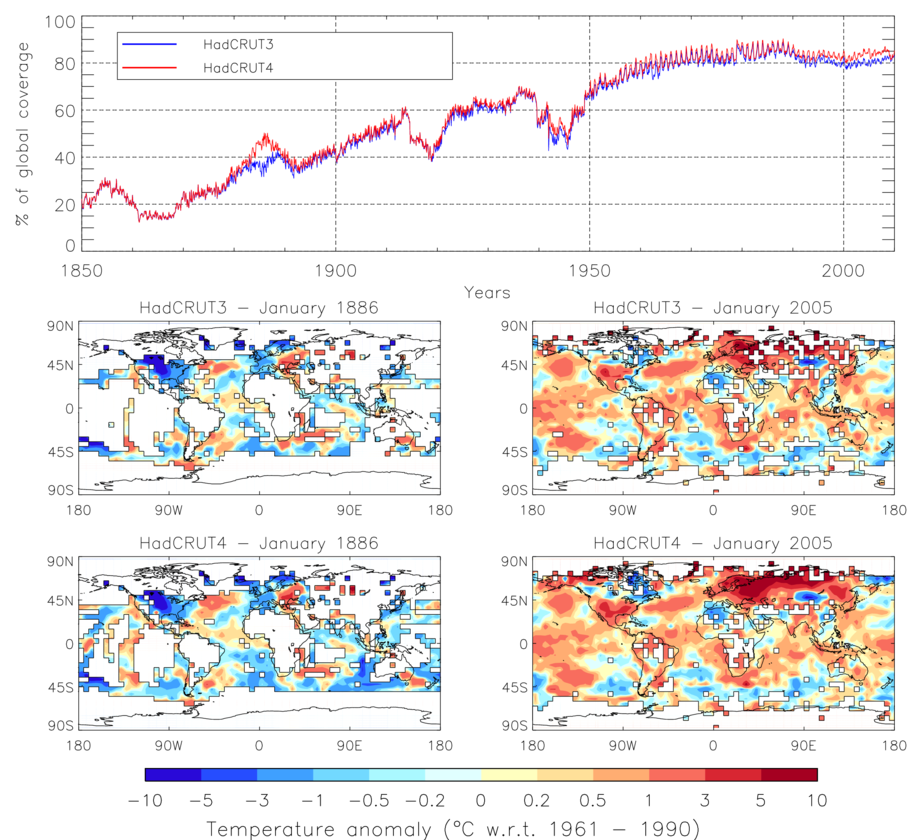
Figure 5 - Improvements in global coverage in HadCRUT4. Top: the percentage of global area observed. Bottom: anomaly maps for HadCRUT3 and HadCRUT4 for months of notable improvement in observational coverage. Maps show gridded temperature anomalies (deg C) with respect to grid-box average temperatures in the period of 1961-1990.

Figure 6 - Global average HadCRUT4 temperature anomaly time series 1850-2010 (deg C, relative to the long-term average for 1961-90). (top) monthly time series and components of uncertainty in monthly averages. (middle) annual time series and components of uncertainty in annual series. (bottom) decadally-smoothed series and components of uncertainty in the decadally smoothed series.

Figure 7 - Comparison of annual, global average temperature anomalies 1850-2010 (deg C, relative to the long-term average for 1961-90) for the HadCRUT4 median (red) and HadCRUT3 (blue). 95% confidence intervals are shown by the shaded areas.

Figure 8 - Average HadCRUT4 temperature anomaly time series 1850-2010 (deg C, relative to the long-term average for 1961-90) for the northern hemisphere. (top) monthly time series and components of uncertainty in monthly averages. (middle) annual time series and components of uncertainty in annual series. (bottom) decadally-smoothed series and components of uncertainty in the decadally smoothed series.
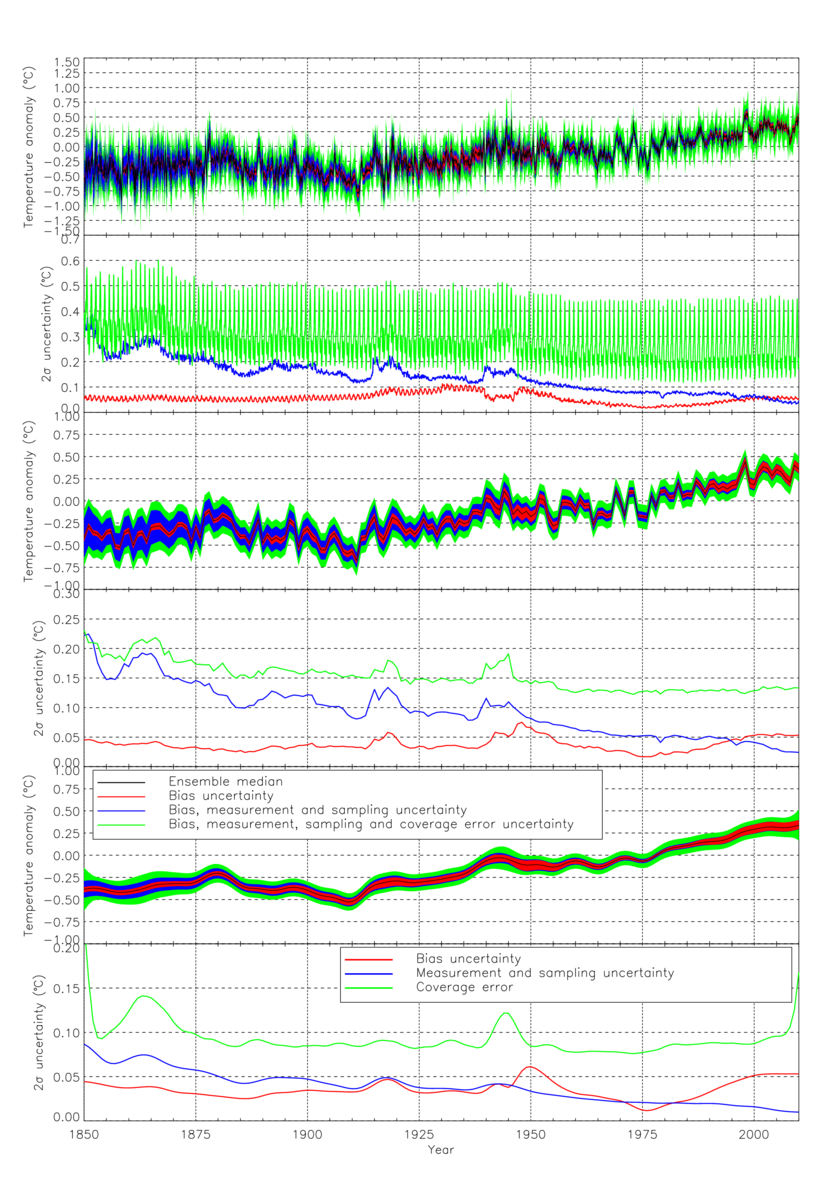
Figure 9 - Average HadCRUT4 temperature anomaly time series 1850-2010 (deg C, relative to the long-term average for 1961-90) for the southern hemisphere. (top) monthly time series and components of uncertainty in monthly averages. (middle) annual time series and components of uncertainty in annual series. (bottom) decadally-smoothed series and components of uncertainty in the decadally smoothed series.
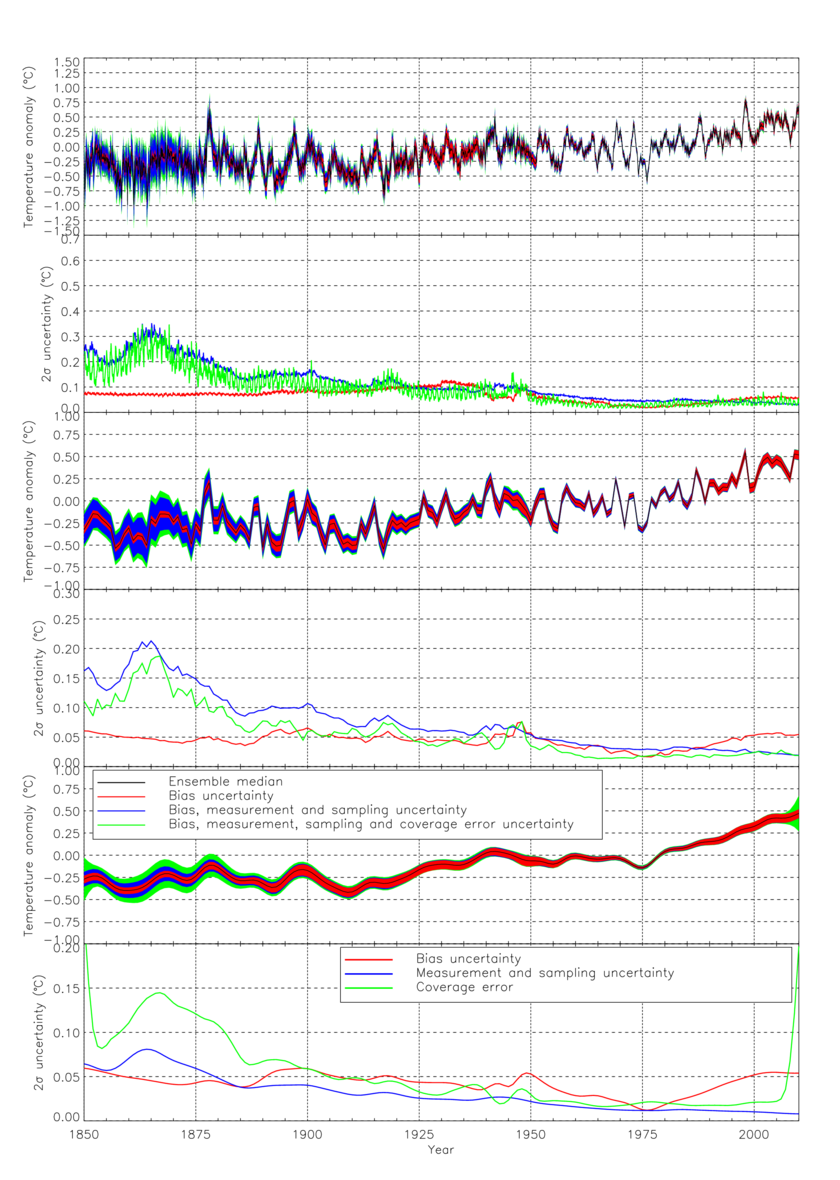
Figure 10 - Average HadCRUT4 temperature anomaly time series 1850-2010 (deg C, relative to the long-term average for 1961-90) for the tropics (30 deg S to 30 deg N). (top) monthly time series and components of uncertainty in monthly averages. (middle) annual time series and components of uncertainty in annual series. (bottom) decadally-smoothed series and components of uncertainty in the decadally smoothed series.
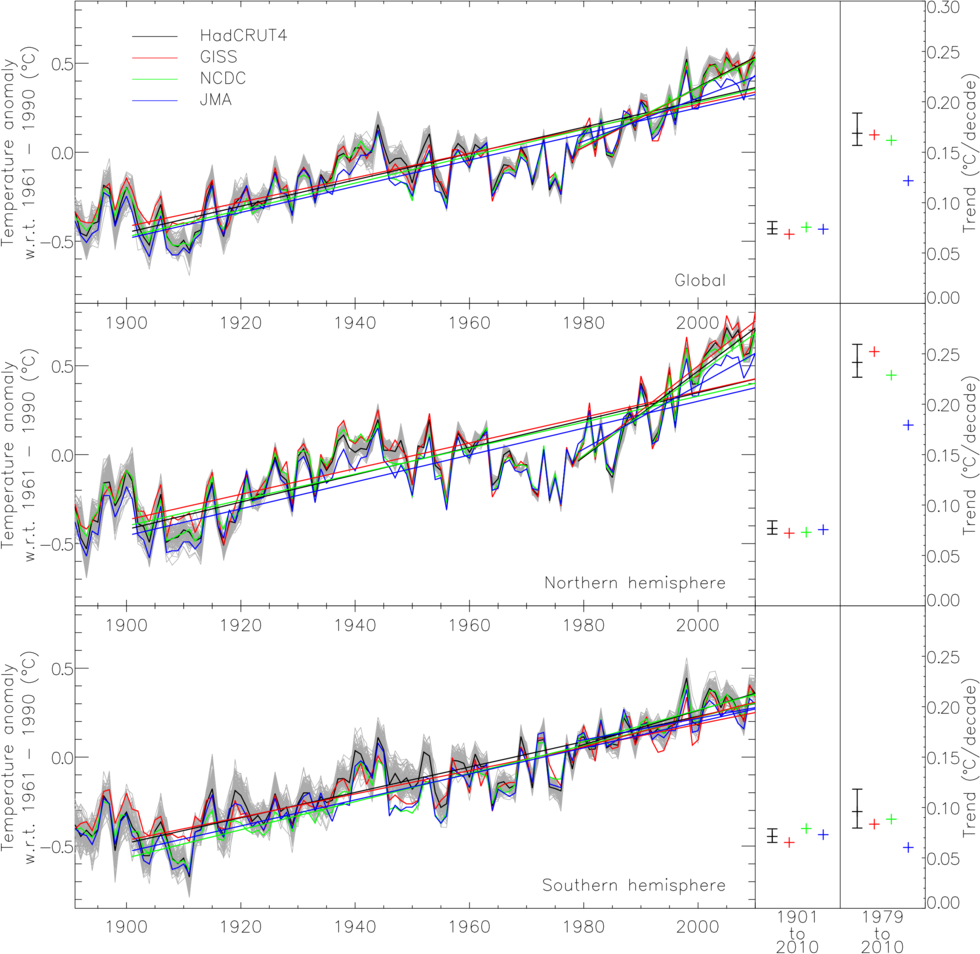
Figure 11 - Annual temperature anomaly development in the HadCRUT4, GISS, NCDC and JMA surface temperature analyses. Least squares linear trends are shown on the right for the periods of 1901to 2010 and of 1979 to 2010. Individual ensemble member realizations of HadCRUT4 are shown in grey. Uncertainty ranges in linear trends for HadCRUT4 data are computed as the 2.5% and 97.5% ranges in linear trends observed in the HadCRUT4 ensemble.
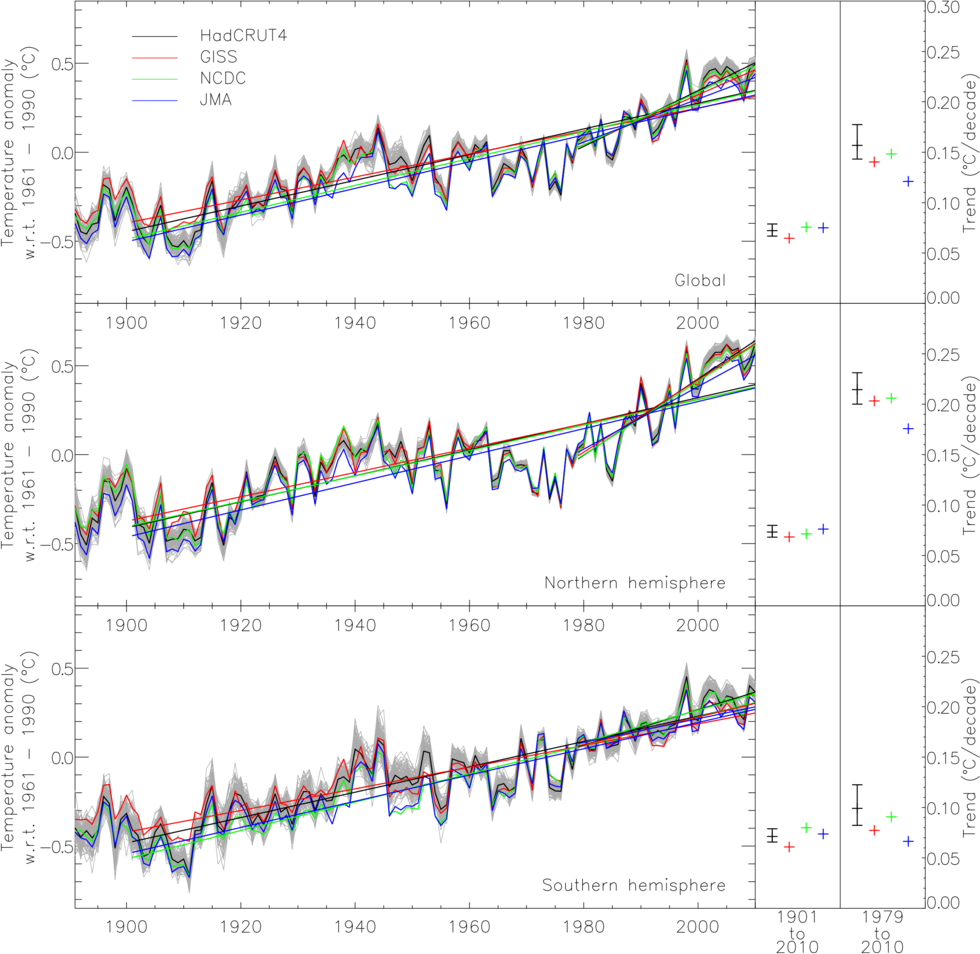
Figure 12 - Annual temperature anomaly development in the HadCRUT4, GISS, NCDC and JMA surface temperature analyses, with dataset coverage reduced to the minimum coverage existing in all four datasets. Least squares linear trends are shown on the right for the periods of 1901 to 2010 and of 1979 to 2010. Individual ensemble member realizations of HadCRUT4 are shown in grey. Uncertainty ranges in HadCRUT4 data are computed as the 2.5% and 97.5% ranges in linear trends observed the HadCRUT4 ensemble.
Commercial and media enquiriesYou can access the Met Office Customer Centre, any time of the day or night by phone, fax or e-mail. Trained staff will help you find the information or products that are right for you. |
 |
Maintained by: Colin Morice |
© Crown Copyright
|